

Presentation at the Technical University of ClausthalC.J.Campbell
December 20001. Title
Ladies and Gentlemen
· Thank you for inviting me to make this presentation.
· To-day, I am going to talk about the depletion of oil. I am a petroleum geologist and have been studying the subject directly and indirectly for many years. It is a very important subject, as is amply confirmed by recent events.
· I compliment the organisers for raising the subject in Germany. It is a large and strong country, which can exert its influence both on Europe and the World. Truth has always proved a powerful weapon. It needs to take action.2. Sub-Title
The title of my talk is Peak Oil. It truly is a turning point for Mankind. It will affect us all. It is a large subject, and it will take us about an hour to work through it.3. Purpose
The purpose of the talk is to evaluate the resource base and its depletion. Then we can go on to study the present crisis and try to see how it will evolve. Finally we can think specifically about Germany's predicament.4. Main Points
In summary, these are the main points that we have to grasp:
· Conventional oil - and I will explain what I mean by that - provides most of the oil produced today, and is responsible for about 95% all oil that has been produced so far.
· It will continue to dominate supply for a long time to come. It is what matters most.
· Its discovery peaked in the 1960s. We now find one barrel for every four we consume.
· Middle East share of production is set to rise. The rest of the world peaked in 1997, and is therefore in terminal decline
· World peak comes within about five years
· Non-conventional oil delays peak only a few years, but will ameliorate the subsequent decline
· Gas, which is less depleted than oil, will likely peak around 20205. Discontinuity
· As I said, peak oil is a turning point for Mankind.
· The economic prosperity of the 20th Century was driven by cheap, oil-based energy
· Everyone had the equivalent of several unpaid and unfed slaves to do his work for him
· These slaves are now getting old and wont work much longer
· We need to find how to live without them6 Slaves

The energy slaves of modern Man7. Not a Repeat
I should stress that we are not facing a re-run of the Oil Shocks of the 1970s
· They were like the tremors that herald an earthquake, although serious enough, tipping the World into recession
· Now we face the earthquake itself
· This shock is very different. It is driven by resource constraints, not politics - although of course politics do enter into it.
· It is not a temporary interruption but the onset of a permanent new condition
· The warning signals have been flying for a long time. They have been plain to see. But the world turned a blind eye, and failed to read the message8 Amazingly unprepared
· Our lack of preparedness is itself amazing, given the importance of oil to our lives
· The warnings were rejected and discredited as if they were words of soothsayers and prophets.
· I myself have been called a Cassandra
· But the warnings were not prophecy
· It simply recognised two undeniable facts
· First: you have to find oil before you can produce it
· Second: production has to mirror discovery
· Discovery reached a peak in the 1960s - despite all the technology we hear so much about and a worldwide search for the best prospects
· It should surprise no one that we now face the corresponding peak of production. This simple reasoning has been however rejected by flat-earth economists and others with a blind faith in technology and markets forces. Worse still, governments have listened to bad advice.
· There are many vested interests bent on confusion and denial, which I will touch on later9 Europe's Revolt
Let is look briefly at what happened in Europe a few weeks ago.
· The French fishermen blockaded the Channel Ports because their fuel costs had doubled, even though their fuel was already tax-free
· The dispute spread rapidly to England and other countries
· Schools were closed. Hospitals had a red alert
· Supermarkets started rationing bread
· Trade and industry was seriously interrupted: the cost was huge
· People lost confidence in their government : its popularity fell sharply
· If an interruption in supply lasting only a few days could cause such havoc, it surely demonstrates how utterly dependent on oil we have become.10. Depletion
Depletion is an easy concept to grasp.
· Think of an Irish pub full of happy people. Think of their pleasure at the first sip from a full glass
· Think of the frowns that begin to cross their faces when their glasses are half-empty. They know they have drunk more than is left. It is the turning point
· Watch them savour the last drops
· But the evening is young. When the glasses are empty, they can order another round.
· But eventually closing time comes when there are no more rounds to be had
· That is the meaning of depletion
· We need to know how big each glass - or oilfield - is, and
· We need to know how many more rounds there are - that is to say how many more oilfields are left to find11. Date of Peak
I stress that we are not about to run out of oil, but production is about to reach a peak. When peak comes depends on the issue of Rates
· Discovery Rate - we now find one barrel of conventional oil for every four we consume
· Extraction Rate is controlled by the physics of the reservoir
· Demand is driven by economic growth and price.
Remember price is not the same as cost. It depends on cost but also tax and scarcity12. What to Measure
Before measuring something, the first step is to decide what exactly to measure. It is a question every butcher asks. Does he weigh the meat or the bones as well?
· There are many different kinds of oil
· Each has its own endowment in Nature, characteristics, costs, and rate of extraction.
· Production of each type starts and ends at zero reaching a peak in between,
· Some rise to peak slowly, others quickly
· We need to identify and measure each type : we need to separate the meat from the bones13 Conventional Oil
It is convenient to identify so-called Conventional Oil. It is the meat not the bones. It has contributed most oil to-date and will dominate all supply long into the future. We may concentrate on it, as it controls the date of peak.
But there is no universal agreement on how to define it. Here I will exclude
· Oil from coal and "shale"
· Bitumen and Extra-Heavy Oil
· Heavy Oil
· Deepwater Oil
· Polar Oil
Natural Gas liquids are also excluded because they belong to the gas domain.
The database is not up to clearly distinguishing all these categories but we should at least know what we aim to do.14. Simple Questions
We may start by asking two simple questions
· How much oil has been found? and
· When was it found?
They sound simple, but they are difficult to answer because the data are weak.15. Ambiguity & Bad Data
There is no consistency in what is reported.
· There is a large range even for production, which is simply reading the meter
· Reserve estimates are still less reliable
· The treatment of gas liquids ranges widely
There are two main sources of public data.
· The Oil & Gas Journal and World Oil are trade journals that compile information given to them by governments. They are not qualified to assess the validity of the information.
· Another widely used source is the BP Statistical Review. BP is in a position to evaluate the data, but it declines to do so, and instead just reproduces the Oil and Gas Journal.
· Lastly is the industry database, which is relatively reliable but too expensive for most analysts to access.
· All these sources are different. None of them are very intelligently compiled.16 Reserve Reporting
· The industry has systematically under-reported the size of discovery for a host of good commercial and regulatory reasons. It understandably prefers to revise the reserves upwards over time than book them all up front. It is not its job to forecast the future.
· For most purposes, it does not matter, but we need to know the real record of the past if we are to use the trend to forecast the future.
· Governments variously under-report or over-report, or simply fail to update their estimates. As many as 70 countries reported unchanged numbers in 1999, which is utterly implausible.
· We need the "best estimate". It is often called Proved & Probable, such that any revisions are statistically neutral17 Dating Revisions
· An oilfield contains what it contains because it was filled in the geological past, but knowledge of how much it contains evolves over time.
· If we want a genuine discovery trend, we need to backdate revisions to the discovery of the field.
· Failure to backdate gives the illusion that more is being found than is the case. It is a cause of great misunderstanding
18 BP Reserves
This demonstrates how BP reports reserves, failing to backdate the revisions. It has misled many analysts. The large increases in the late 1980s were simply due to the OPEC quota wars. Nothing was actually added, as I will explain.
19 Spurious Revisions
I should explain this large increase in greater detail.
· Kuwait added 50% in 1985 to increase its OPEC quota, which was based partly on reserves. No corresponding new discoveries had been made. Nothing particular changed in the reservoir.
· Venezuela doubled its reserves in 1987 by the inclusion of large deposits of heavy oil that had been known for years.
· It forced the other OPEC countries to retaliate with huge increases
· Note too how the numbers have changed little since despite production..
But it is not quite as simple as that, because the early numbers were too low, having been inherited from the companies before they were expropriated. Some of the increase was justified but it has to be backdated to the discovery of the fields concerned that had been found up to 50 years before.
20 Popular Image
The failure to backdate gives this misleading popular image of growing reserves. It is widely used by flat-earth economists in support of classical economic theories of supply and demandI hasten to add that by no means all economists believe in a flat-earth. There are enlightened economists who now relate economics with resources, and they are coming to the fore.
21 Reality & Illusion
This shows the effect of proper backdating. The discovery trend shown in yellow is falling not rising.
22 Impact of Technology
You will hear many claims for technology. No one disputes the huge technological advances of the industry. But, what has been the impact?
· In Exploration, it shows better both where oil is and where it is NOT - thus allowing better estimates of the potential to be made.
· In Production, it keeps production rate higher for longer, but has little impact on the reserves themselves
Note that much of the oil in a reservoir cannot be extracted because it is held there by capillary forces and natural constrictions. The percentage recovered can be improved in some cases by injecting steam and such methods, but by no means all fields are susceptible to treatment. Most modern fields are produced to maximum efficiency from the outset.23 Prudhoe Bay
This is well illustrated by the Prudhoe Bay field. It is the largest field in N. America.
· The Operator internally estimated its reserves at 12.5 Gb in 1977, but reported 9 Gb.
· Various enhanced recovery methods were started in 1982
· Decline commenced in 1988. Enhanced recovery did arrest decline for one year, but then the decline was steeper.
· The field will barely make the original estimate. Nothing was added
This is quite typical. I could show you may similar examples.
Such plots are incidentally a good way to estimate genuine reserves
24. Yet-to-Find
Now let's turn to how much is yet-to-find25 North Sea Generation
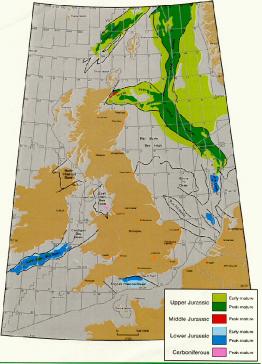
· A geochemical breakthrough in the 1980s made it possible to relate the oil in a well with the rock from which it came.
· It became possible to identify and map the generating belts. They are few and far between because prolific oil was formed only under very rare geological circumstances. In fact, most of it comes from no more that three or four epochs of intense global warming
· This shows where the oil comes from in the North Sea. It was formed about 145 million years ago at the end of the Jurassic period.
· There is no possibility of finding oil outside these generating trends, and we now know where most of them are.
26 Seismic
Great advances in seismic technology make it possible to see the smallest and most subtle trap.
· In general, this better knowledge has reduced the perceived potential, because it shows the absence of large prospects.
· We can find a needle in a haystack, but it is still a needle. We did not need the resolution to find the giant fields holding most of the world's oil.
· It means we have a much better knowledge of the endowment in Nature than we used to have.
27 Creaming Curve
This is the so-called creaming curve.
· It plots discovery against exploration wildcats. They are the wells that either do - or do not - find a new field
· The largest fields are usually found first for obvious reasons, being too large to miss.
· The curve flattens until new discoveries are too small to be viable. It gives a good idea of how much is left to find.
· There are other statistical techniques but there is n't time to cover them here
28 Shell Experience
· The same applies to an individual oil company
· Shell has found about 60 Gb with almost 4000 exploration wells, drilled over its entire history since 1895. If it drilled as many again, it could expect to find only 16 Gb
· Other companies have not had such a successful record.
29 Parameters
To sum up, these are the main parameters for conventional oil.
· The numbers are shown as computed but should be generously rounded
· We have produced almost half what is there, and we have found about 90%
· We produce 22 Gb a year but find only 6 Gb. That is to say, we find one for every four we consume from our inheritance of past discovery
· The current depletion rate is about 2 % a year30 Growing Gap
· This shows the growing gap between discovery and consumption as we move from surplus to deficit
· The yellow curve shows exploration drilling.
· Note that the level of activity barely affects the discovery trend. It destroys the flat earth heresy that discovery is driven by market forces
31 Spike
But this year, we did have an exceptional discovery spike.
· The underlying general trend was down to about 6 Gb
· New deepwater discovery, here treated as non-conventional, added about 4 Gb. It may well be approaching a peak too
· And there were two exceptional large finds in hitherto closed areas in the Caspian and Iran adding about 12 Gb
But even this exceptional year did not quite balance consumption32 Depletion Examples
I would now like to quickly demonstrate a few examples of depletion
· Remember that the peak of discovery has to be followed by the peak of production
· Remember too that peak production generally comes close to the midpoint of depletion when half the total has been used.33 US-48
Let us start with the US-48, the most mature oil country of all.
· It had plenty of money, every incentive with the oil rights in private hands and soaring imports
· It had a large prospective territory
· We can be sure that if more could have been found, it would have been found.
· So what did Nature deliver?34 US-48 Graph
Discovery, shown in green, peaked in 1930 at the edge of the chart. Production peaked 40 years later
35 N.Sea graph
It is the same pattern in the North Sea, but advances in technology reduced the time lag to 27 years. We are getting better at depleting our resources.
36 World graph
This is the world as a whole.
· The green bars show discovery, highlighting a few exceptional spikes in the Middle East.
· The oil shocks of the 1970s cut demand so that the actual peak came later and lower than would otherwise have been the case
· It means that the decline is less steep than it would otherwise have been
· It reminds us that if we produce less today, there is more left for tomorrow.
· It is a lesson we need to relearn as a matter of urgency.
37 Distribution
This shows the distribution of oil
Note how North America has consumed most of its oil
Note how the Middle East has most of what is left
38 Swing Share
That introduces the idea of swing share
· The Five Middle East countries have been forced into a certain swing role around peak. For a certain limited period, they can - at least in resource terms - make up the difference between world demand and what the rest of the world can produce.
· The yellow line shows their share of world production
· The green bars show price
· Share was 38% in 1973 at the time of the first oil shock
· It had fallen to 18% by 1985 because new provinces in the North Sea, Alaska and elsewhere started to deliver flush production from giant fields which are usually found first
· I stress that these new provinces had been found before the shock and were not a consequence of it as is so often claimed by flat-earth economists
· Share is now at about 30% and set to rise. This time there are no new major provinces waiting to deliver, or even in sight, save perhaps the Caspian
39 ME Gulf Graph
· This shows the depletion of the Middle East.
· Actual production has been far below what was possible
· Note how rapidly production will have to rise to meet demand even with that being curbed by rising price. It is optimistic to believe that such an increase can be achieved in time.
40 Expropriation
I might digress briefly to explain the impact of expropriation.
· It started with BP in Iran in 1951 but had spread to the other main producers by the 1970s.
· The major companies lost their main sources of supply.
· Had they remained in control, they would have produced the cheap and easy oil before turning to the expensive and difficult. It would have given a gradual transition as depletion began to grip
· But when they lost their main supplies, they moved to the expensive and difficult areas and they worked flat out.
· The main OPEC governments were left with the cheap and easy stuff.
· It is contrary to normal economic practice and one of the causes of the present crisis41 Inheritance
This I think is a very compelling graph.
· The red line is discovery smoothed with a 10 year moving average
· It shows a clear downward trend, easy to extrapolate, as shown in orange
· The green line is production, extrapolated at a 2% growth to match the past trend.
· Our inheritance is the area between the red and green lines.
· We have to eat into our inheritance of past discovery because future discovery is insufficient
· There just is not enough to sustain growth, or even hold current production for long
· The blue line shows the inevitable decline
42 World depletion
This shows a production profile imposed by these known and easily understood resource constraints.
It is not prophecy. It is reality
43 Two-phased Crisis
We face therefore a two-phased crisis, the first of which has already arrived, as predicted
· A price shock comes when Middle East share reaches a critical threshold, and even it cannot raise production fast enough to meet demand. Non-Middle East production falls. That is happening now.
· The second phase comes around 2010 with the onset of chronic long-term shortage, as the Middle East can no longer meet even current demand, never mind growth. By then, it will be asked to supply 50% of the world's oil, which will be beyond is ability44 Peak dates
In short
· Conventional oil peaks around 2005
· All hydrocarbons around 2010
· Gas around 2020
· Gas liquids peak a little after gas, as extraction rates increase
· The decline after peak is about 3% a year45 All hydrocarbons Graph
This illustrates the depletion of all hydrocarbons
46 Denial & Obfuscation
I would now like to ask why this important subject is not better understood47 Flat Earth
People once believed the earth was flat. Scientific observations to the contrary were treated as heresy. Look at the threatened, suspicious and hostile expressions on the faces of these mediaeval monks. They were the Establishment of the day. The same expressions are now to be found in many of the world's governments.

48 Political Reactions
We have several political reactions, which we might almost call conspiracies
· The United States seeks to exaggerate the world's oil to reduce OPEC's confidence. It pretends that it does not depend on Middle East oil. It puts out very flawed studies by the US Geological Survey and the Department of Energy. I
· OPEC, for its part, exaggerates its resource base to inhibit non-OPEC investments and moves to energy savings or renewables. It fears a repetition of the price collapse that followed the last shocks, not realising that it is a different world.
· Companies conceal depletion because it sits badly on the investment community49 USGS
· The USGS has failed to live up to its scientific reputation
· It has assessed the Undiscovered Potential of each basin with a range of subjective probabilities. It has a Low Case for the most sure and a High Case for the least sure. The High Case itself has little meaning. You might as well say that there is a 5% chance that I am a frog.
· The Low Case is fairly good, consistent with the discovery trend, but The Mean value, which is the one they publicise is meaningless because it is influenced by the High Case. This has been confirmed by experience in the real world because the Mean estimate is already 100 Gb short, five years into the study period
· The notion of "reserve growth" is also flawed. The USGS depicts it as a technological dynamic when it is simply an artefact of reporting practice, not to be extrapolated into the future.
· It claims that Greenland is the most prospective area, which it deems part of North America
· Statoil has now drilled a dry hole on the prime prospect
50 IEA
The International Energy Agency was established by the OECD countries in the aftermath of the shocks of the 1970s. In 1998, it succeeded in delivering a coded message.
· It showed how a "business as usual scenario" could not be fulfilled without inventing a so-called balancing item of Unidentified Unconventional, which miraculously rises from zero in 2010 to 19 Mb/d in 2020, when the identified makes a ceiling of only 2.4 by 2010. Since the identified deposits are huge, no one needs to find more. The so-called unidentified unconventional is accordingly a euphemism for rank shortage.
· Can anybody really imagine that oil price will still be $25/b when the Middle East supplies 62% of the world's needs
As a political institution it could only send a coded message and was pleased when journalists decrypted it.51 Agip
Most companies have to sing to the stockmarket, but the Italian national company is less concerned by stockmarket imagery. Its Chairman was able to tell the truth:
· "New reserves are failing to keep up with growing output"
· "My forecast is that between 2000 and 2005 the world will be reaching peak..."52. BP Prize
British Petroleum certainly wins the prize for the most oblique reference to depletion when it changes its logo to a sunflower and says that BP stands for Beyond Petroleum
But its executives sit on the board of Goldman Sachs, the bankers. They should accordingly know what BP actually thinks behind the lace curtains of corporate make-believe. What do the bankers say?53 Goldman Sachs
"The rig count over the last 12 years has reached bottom. This is not because of low oil price. The oil companies are not going to keep rigs employed to drill dry holes. They know it but are unable and unwilling to admit it. The great merger mania is nothing more than a scaling down of a dying industry in recognition of the fact that 90% of global conventional oil has already been found." - Goldmann Sachs, August 199954 Shell
Shell says it in other words
"There was a time when oil and gas reserves seemed endless..." - November 1999 Advertisement55 Merger Mania
Actions speak louder than words.
· The major companies and many others in the industry are merging and shedding staff
· They are also buying their own stock
· These are moves to downsize because there are no major investment opportunities left
· Their past is worth more than their future - and they know it.56 What is all adds up to
I will try now to conclude with some general comments, starting with a oil price57 Oil price Plot
· Oil outside the Middle East peaked in 1997 as easily foreseen.
· It should have heralded a gradual rise in price from growing Middle East control, shown in green. But instead there was an anomalous fall.
· It is a volatile unstable market that has failed to manage this critical resource.
58 Oil Price Collapse
· Price collapsed in 1998 because of the interaction of warm weather, an Asian recession, the devaluation of the rouble, events in Iraq, false supply estimates by the IEA that prompted higher OPEC production and perhaps some manipulation by insiders
· Now there is a firm upward trend based on rising demand, the inability to offset natural decline in giant old fields, and falling discovery
· The market hangs on Opec's words - but Opec has lost control59 Oil Price plot repeated
Instead of the gradual increase starting in 1997, we now face a more dramatic increase, shown in red
60 Spare Capacity
· Spare capacity can mean many things. A closed flowing well is the only form of spare capacity that can deliver quickly. All the other elements take investment, work and, above all, time to deliver.
· OPEC has very little operational spare capacity. It is working flat out. It has to run faster to stand still, as it desperately tries to offset the natural decline of its old fields. It will be hard pressed to meet the demands made upon it even to maintain current world production, never mind growth61 Logical Consequences
· The market is now perceiving that OPEC has lost control. It is a devastating realisation because it means there is no supply-based ceiling on price. Accordingly, prices are set to soar. Don't forget that in to-day's money, oil price went to almost $100 in the 1970 shocks
· Demand must then fall. The poor countries of the world will bear most of the burden. But the United States will be in serious difficulties. There is, I think, a strong danger of some ill-considered military intervention to try to secure oil. A stock market crash seems inevitable, as some investment managers are now telling us.
· The global market may collapse because of high transport costs and global recession.
· Self-sufficiency will become a priority.Here some quick thoughts
62 Energy doesn't matter
· Economists say high oil price does not matter because energy is a smaller percent of GDP
· But you can't eat the internet63 Geologists, engineers and economists
· Geologists find oil, engineers exploit it,
... beware of economists telling you how much is left64 Political immunity
· Oil is ultimately controlled by events in the geological past
... which are immune to politics65 Germany's oil
· Not everyone realises that Germany has had a long oil history. The earliest field in the database was found in 1856, before Colonel Drake drilled his famous well in Pennsylvania. About 600 wildcats have been drilled, about as many as in Norway.
· But they found only about 2.3 Gb of oil, shown as bars.
· The country has now been very thoroughly explored
· I assess its ultimate at about 2.5 Gb.
· Peak production was in 1967, ten years before the midpoint of depletion, which was in 1977.
· Production is now declining at about 3%, much less than would be the case offshore.
· Germany, like the USA, is a good example of a mature oil country whose experience is to be matched elsewhere.
66 Germany's energy policy
Let us consider for the moment what Germany's reaction to what I have discussed should be
· Windmills and bicycles set very good examples, but there are still too many large Mercedes
· It would be a good idea to start rationing gasoline and heating fuel early to provide minimal essential needs at moderate price, perhaps by credit card. It will be a complex task to identify all the special needs of people and evolve a fair and equitable system
· There should be inverted tariffs on electricity so that the more you use the more expensive it becomes
· Germany is a large and powerful country. It should exert its influence on Brussels, which has so far failed miserably to understand the situation. As recently as October 4th it issued a report on Europe's oil supply without mentioning the resource or depletion and suggesting it was just a matter of OPEC politics. It understands nothing.
· Germany should revitalise the BGR to resume the excellent studies, which were undertaken under the previous Director. They were I believe suppressed by the Ministry of Economics, who did not want to know the truth.
· Germany should resist Green pressure to give up nuclear power at precisely the moment it needs more energy, as oil peaks and declines.
· Germany has coal and possibilities for coalbed methane. This industry needs to be rediscovered. It may become economic again
· Germany should encourage its motor manufacturers to move to more efficient engines and hydrogen fuels, especially those made by solar means. It should provide whatever fiscal incentives are needed.
· Germany is in a position to take a lead. It should use its strength to do so.67 Depletion Protocol
Germany should support the idea of a Depletion Protocol whereby the consumers as well as the producers would manage depletion
· It could be easily added to an existing OECD treaty that established the International Energy Agency
· It would provide that no country would produce above its present depletion rate
· No country would import any infringement
· It would bring order and cooperation
· And has been welcomed by the OPEC Secretary General68 Political Response
An oil crisis is bad for politicians.
· Blaming OPEC or the oil companies will not wash much longer.
· It would be better to make a proper analysis of the true position and inform people.
· No one blames the government for an earthquake. So they would n't blame it for an oil crisis either if they realised it was a natural phenomenon
"If you don't deal with reality, reality will deal with you"69 Sky does not fall in at Peak
· Let us not be too alarmist. The roof does not fall in at peak. What changes are perceptions, as people come to realise that the growth of the past becomes the decline of the future.
· It may herald the end of the US economic and cultural hegemony - which some people might think was no bad thing
· Climate concerns recede
· But let us use our current high oil supply intelligently while it lasts to ease the transition70 More efficient vehicles
· For example, much more efficient vehicles have already been designed
· The government should encourage their use by penalising inefficient vehicles with high tax

71 Conclusions
· Peak oil is a turning point for Mankind
· 100 years of easy growth ends
· Population peaks too for not unrelated reasons
· The transition to decline is a period of great tension
· Priorities shift to self-sufficiency and sustainability
· It may end up a better world
